Data Visualization
with Cytoscape
Slides: http://tutorials.cytoscape.org
John "Scooter" Morris and Alex Pico
Online
25 October 2024
Goals and Motivations
- Learn some approaches to effective network visualizations
- Master network layouts and data visualization
- Learn some of the advanced features of network visualization in Cytoscape
- Know where to find relevant Cytoscape apps and tutorials
Introductions
- Executive director, Resource for Biocomputing, Visualization, and Informatics
- Roving Engineer, National Resource for Network Biology
- Cytoscape team since 2006
- Author of over 30 Cytoscape apps
Introductions
- Director, Bioinformatics Core
- Executive director, National Resource for Network Biology
- Cytoscape team since 2006
- Author of over three dozen Cytoscape apps
Introductions
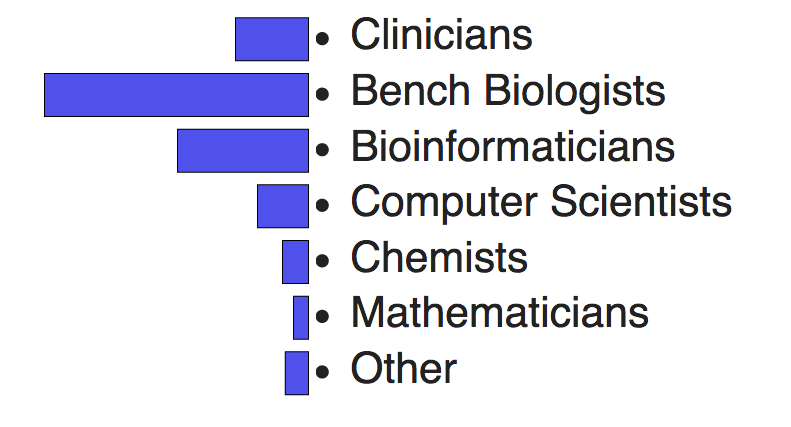
Introductions
Hands-on Custom Graphics
Custom Graphics ProtocolVisualization Challenges
Use these datasets or your own dataset to try out what you've learned!
Transcriptomics Dataset
Sample data set: BRCA.exp.547.med.txt: TCGA Breast Cancer expression data
Proteomics Dataset
Sample data set: JX_90min_prot.txt: Protein prospector output