Advanced Visualization: Graphics
This short protocol reviews how to add graphics to nodes.

Adding Graphics to Nodes
Sometimes, we want to add graphics to nodes. This should be done very sparingly, using Cytoscape's built-in charts. This example uses the Yeast Perturbation example session file.
- Remove the
Node Fill Color mapping and set the default node color to grey. - In the
Node tab of theStyle panel, selectProperties→Paint→Custom Paint 1→Image/Chart 1 . - To add a graphic to all nodes, click the
Def. (default) column of theImage/Chart 1 property. To add a graphic to only selected nodes, select the nodes first and then click theByp (bypass) column forImage/Chart 1 property. - Select
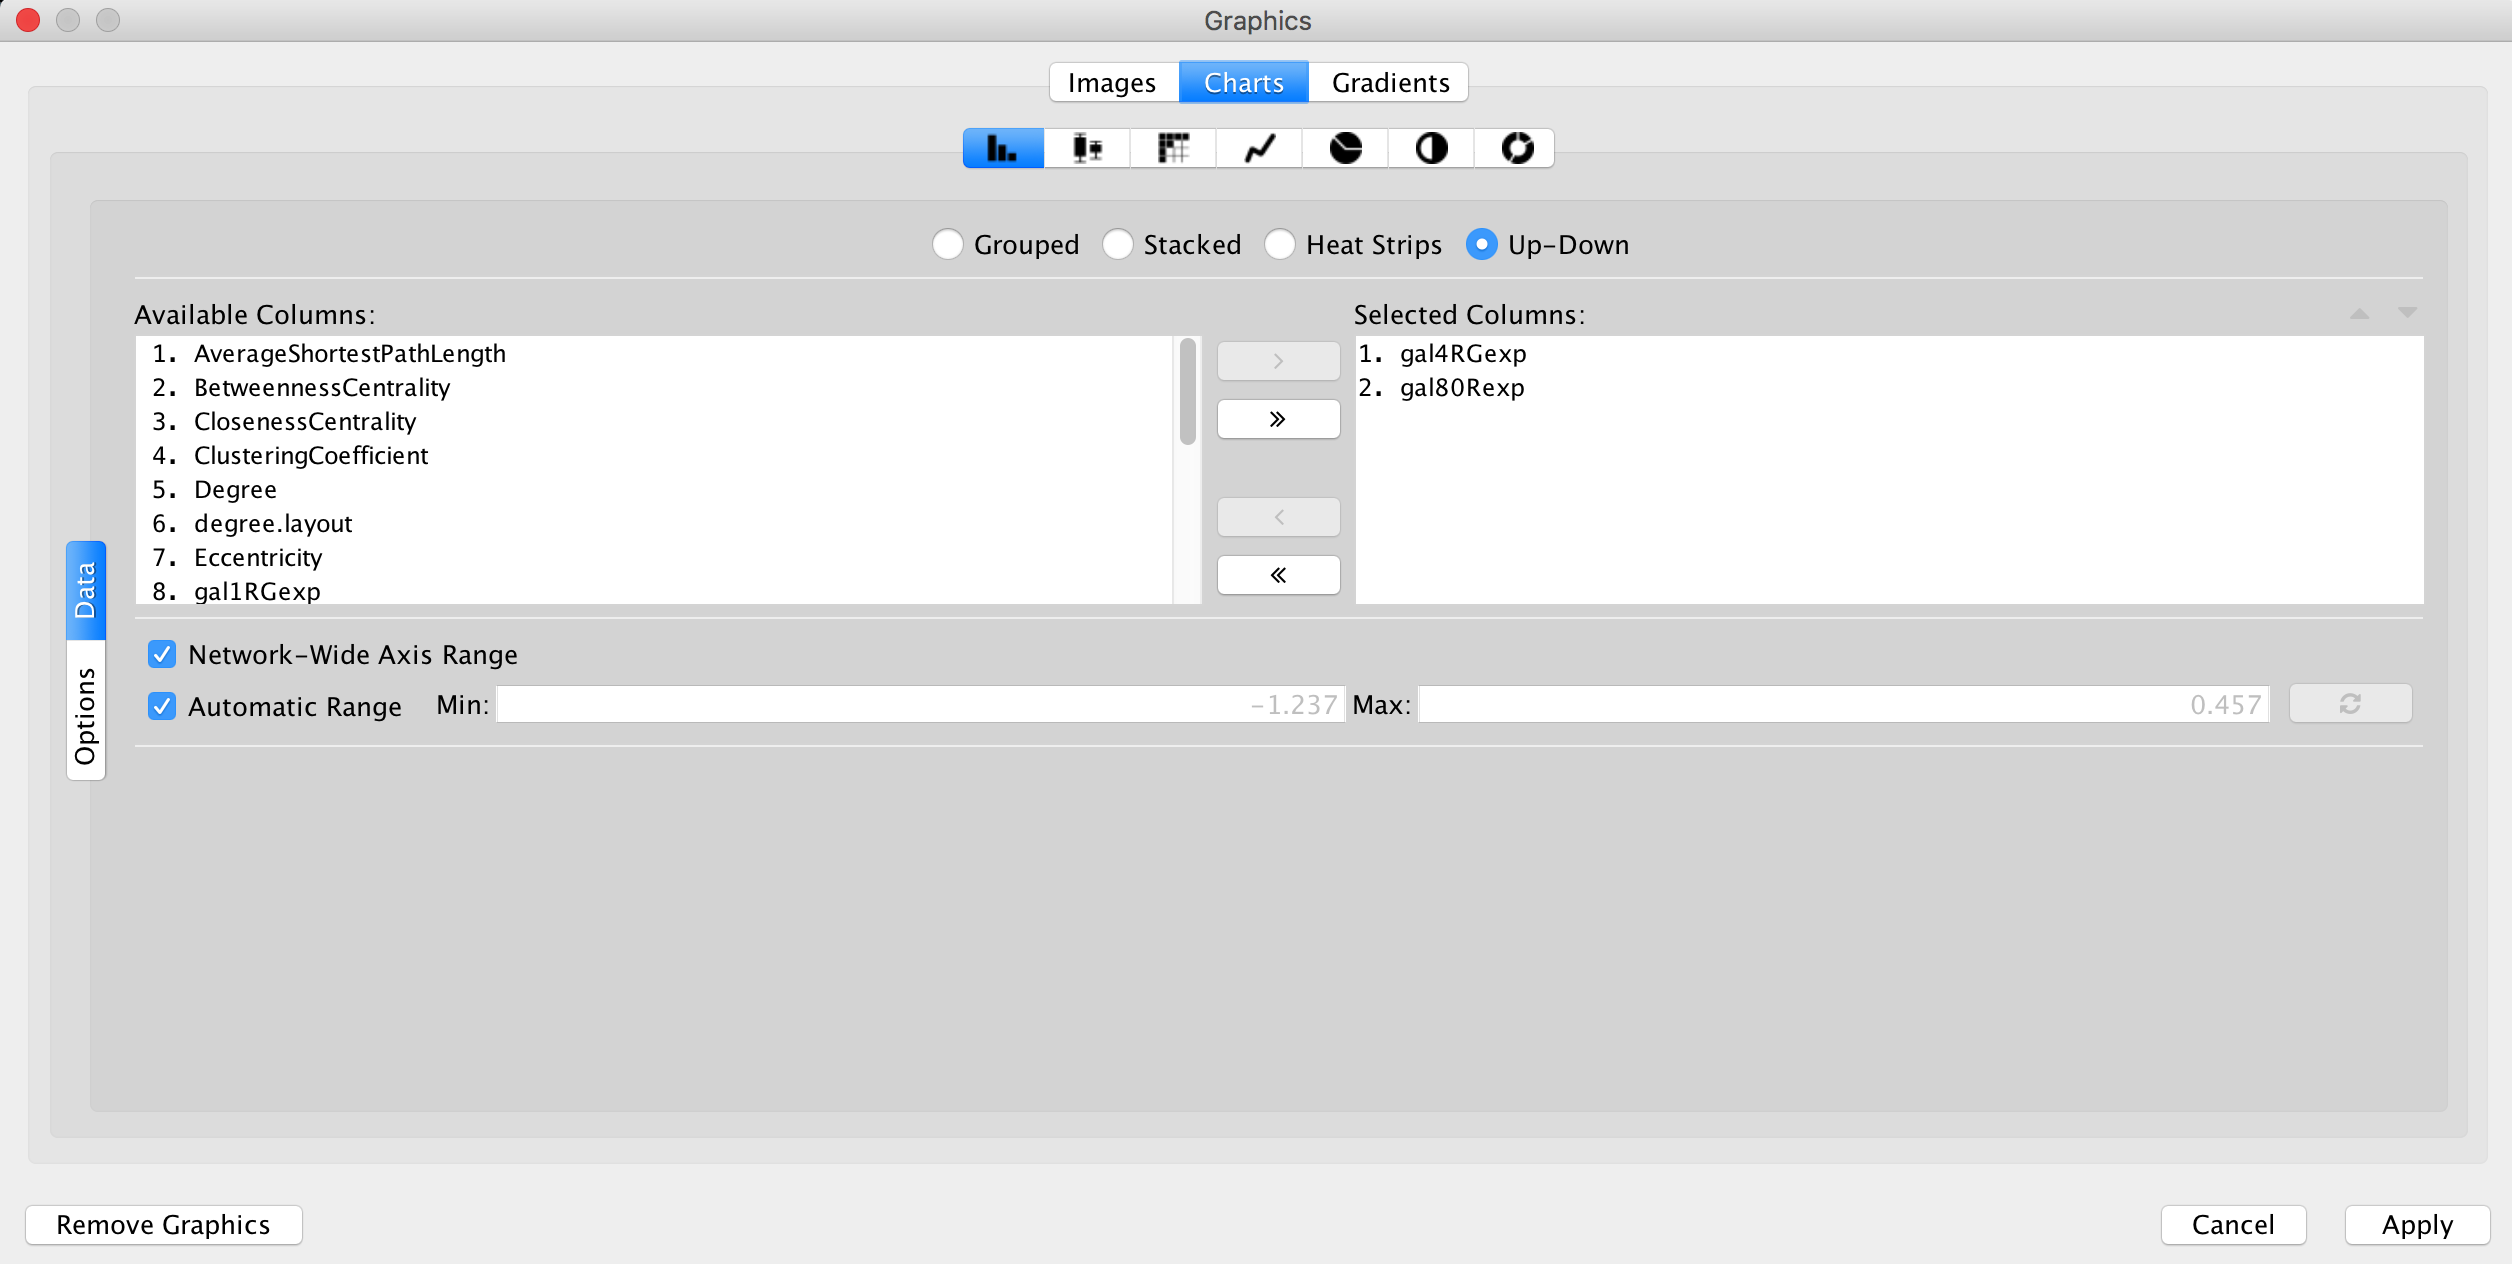
Charts at the top. This will bring up theGraphics panel:
Adding Graphics to Nodes
- Select the type of chart at the top, in this example we are using the
Bar Chart . - For bar charts, select the type of chart using the radio buttons. For this example, we are choosing
Up-Down . - Using the
Add Selected andRemove Selected arrows, move the data columns you want to use for your chart to theSelected Columns list. In this example, we are using gal1RGExp and gal80RExp. - Click the
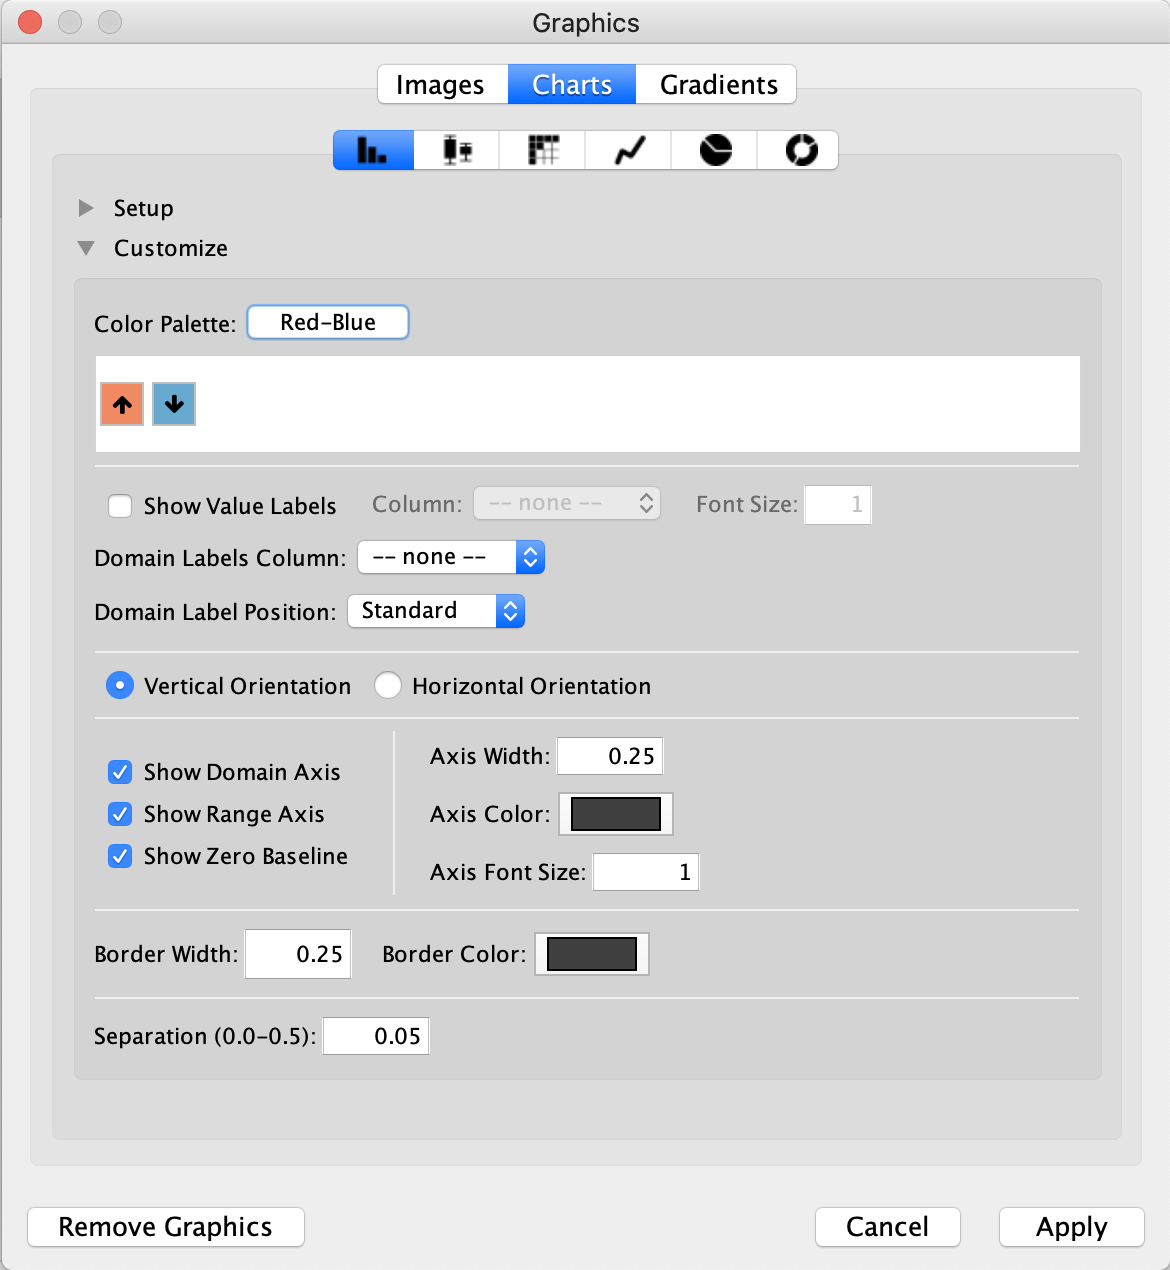
Customize tab, and in theColor Palette drop-down, select the ColorBrewer Diverging red-blue color palette.
Adding Graphics to Nodes
- To add axis to the chart, check the three buttons for
Show Domain Axis ,Show Range Axis andShow Zero Baseline . - For
Separation , enter 0.05. ClickApply .
Adding Graphics to Nodes
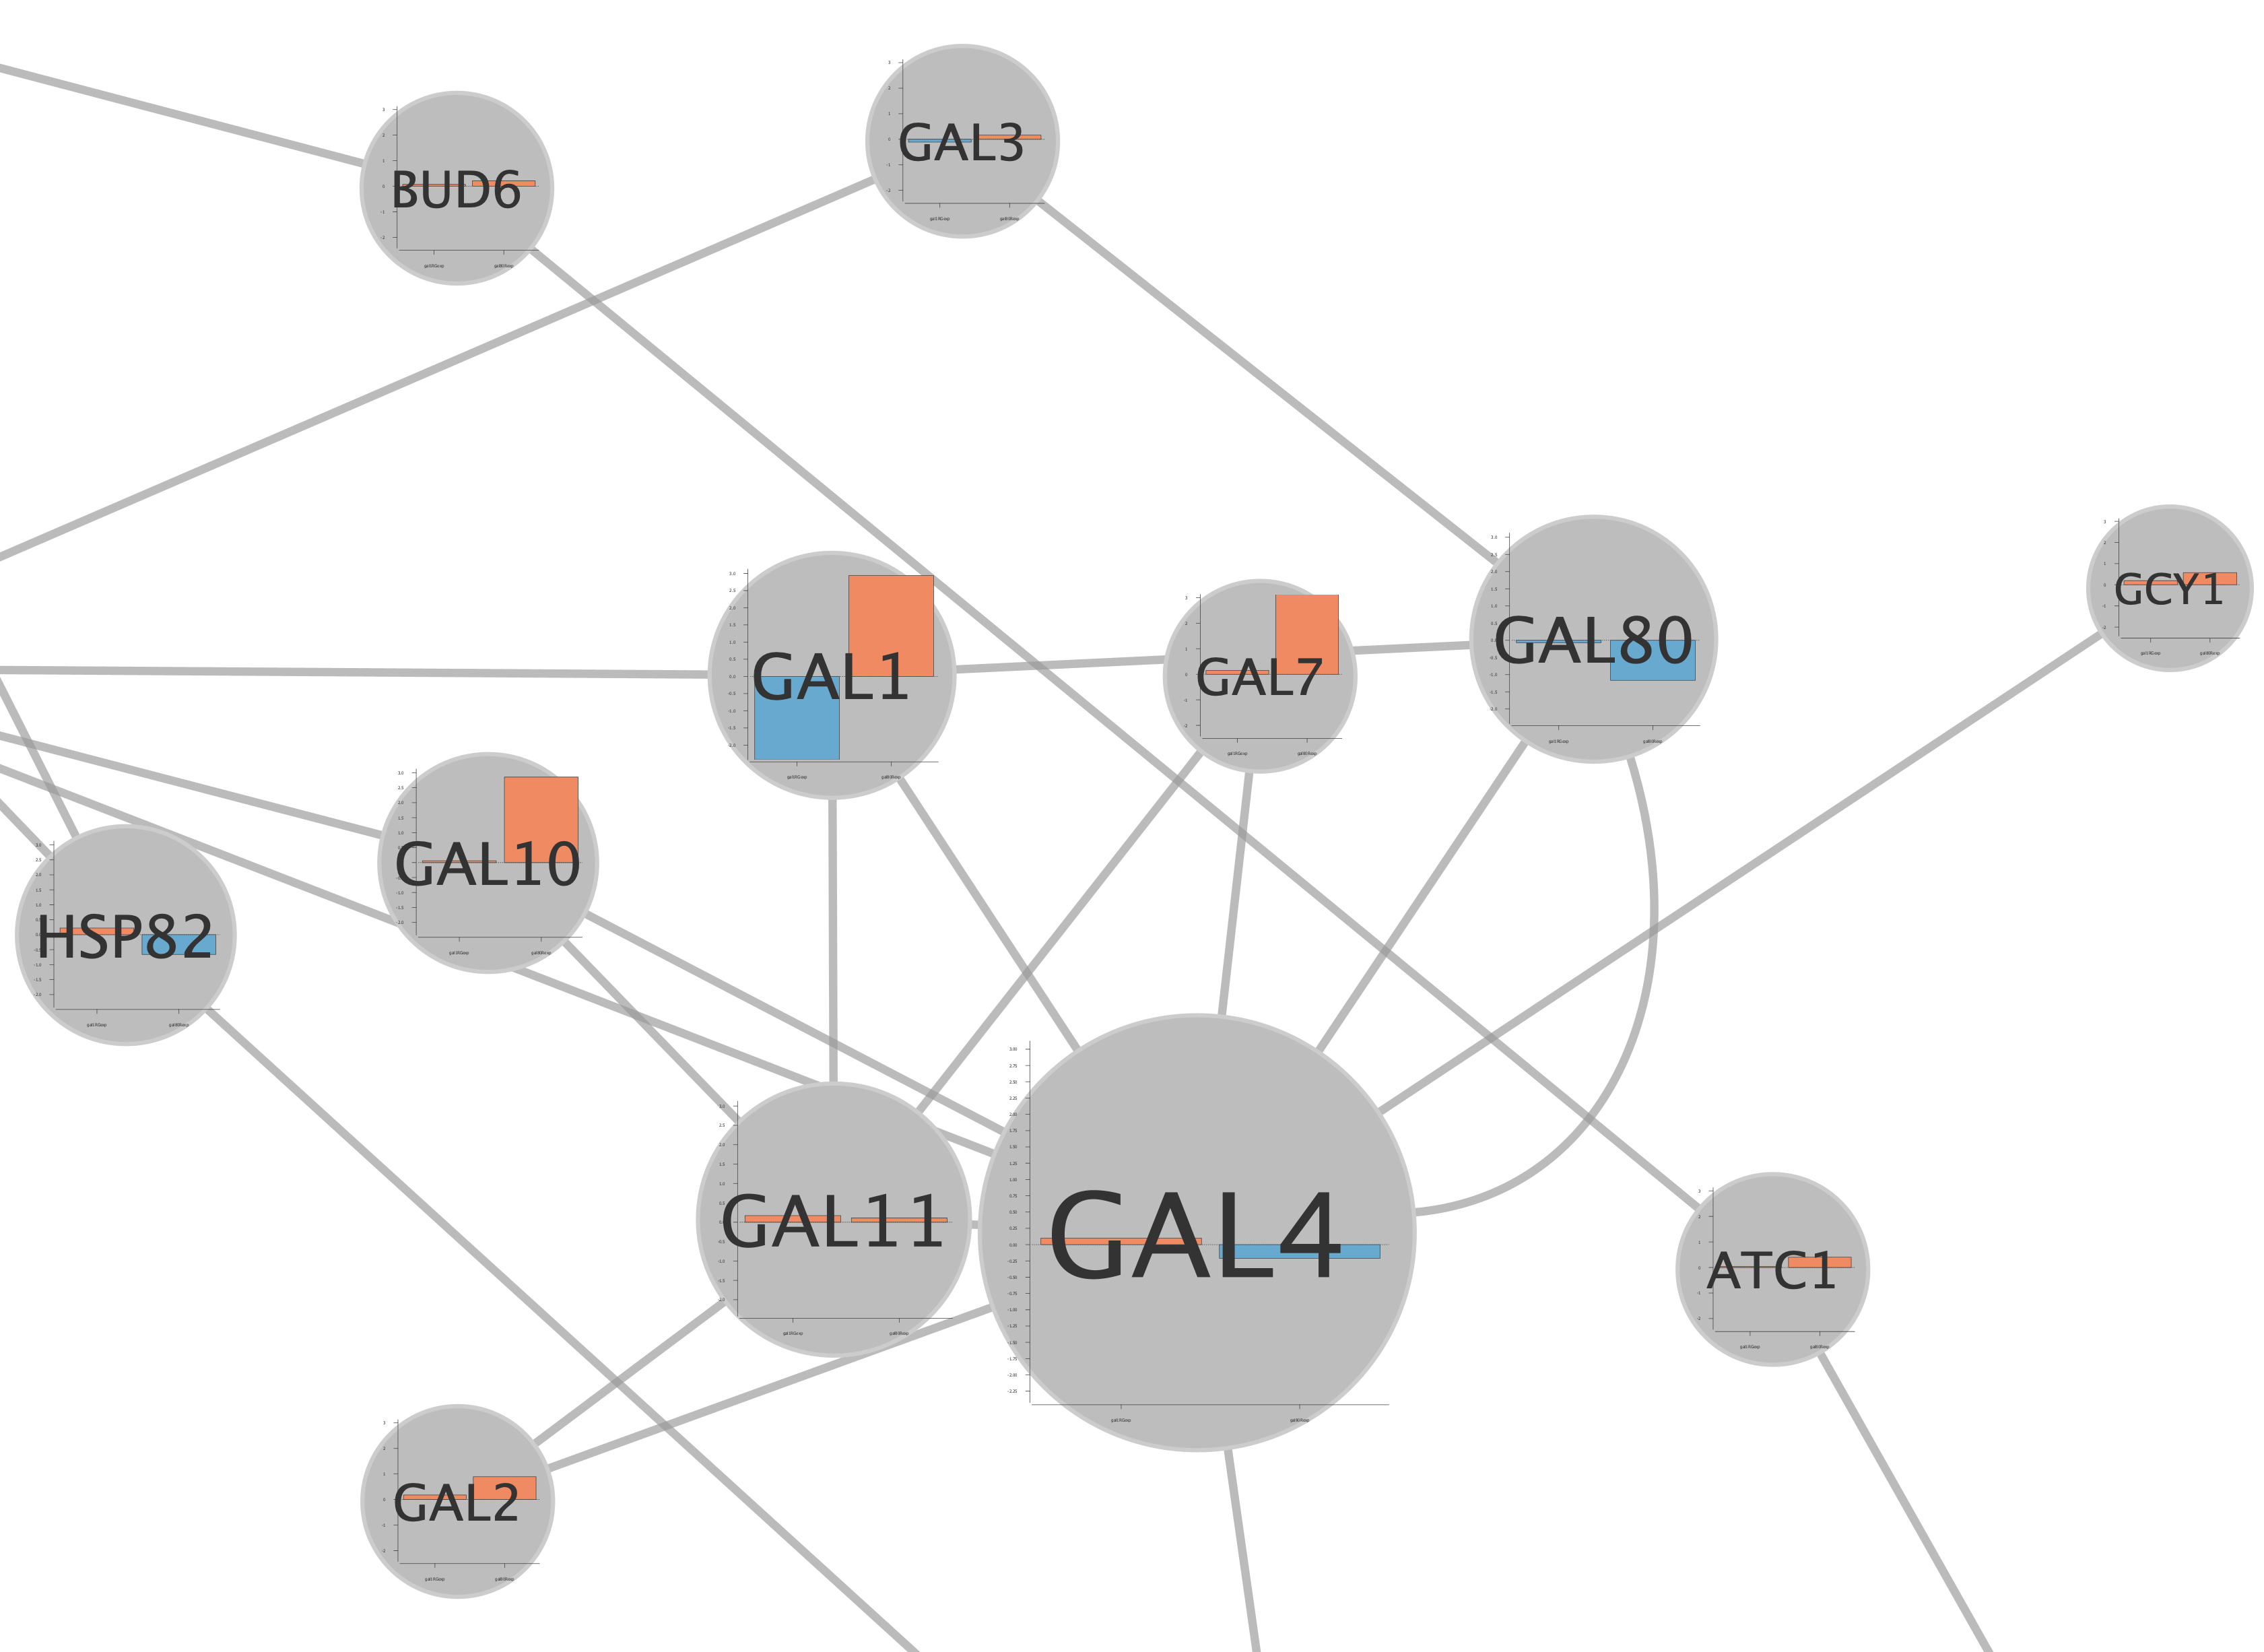
By default, the charts are placed in the middle of the node. We can adjust the placement of the chart using the
Adding Graphics to Nodes
- Add the
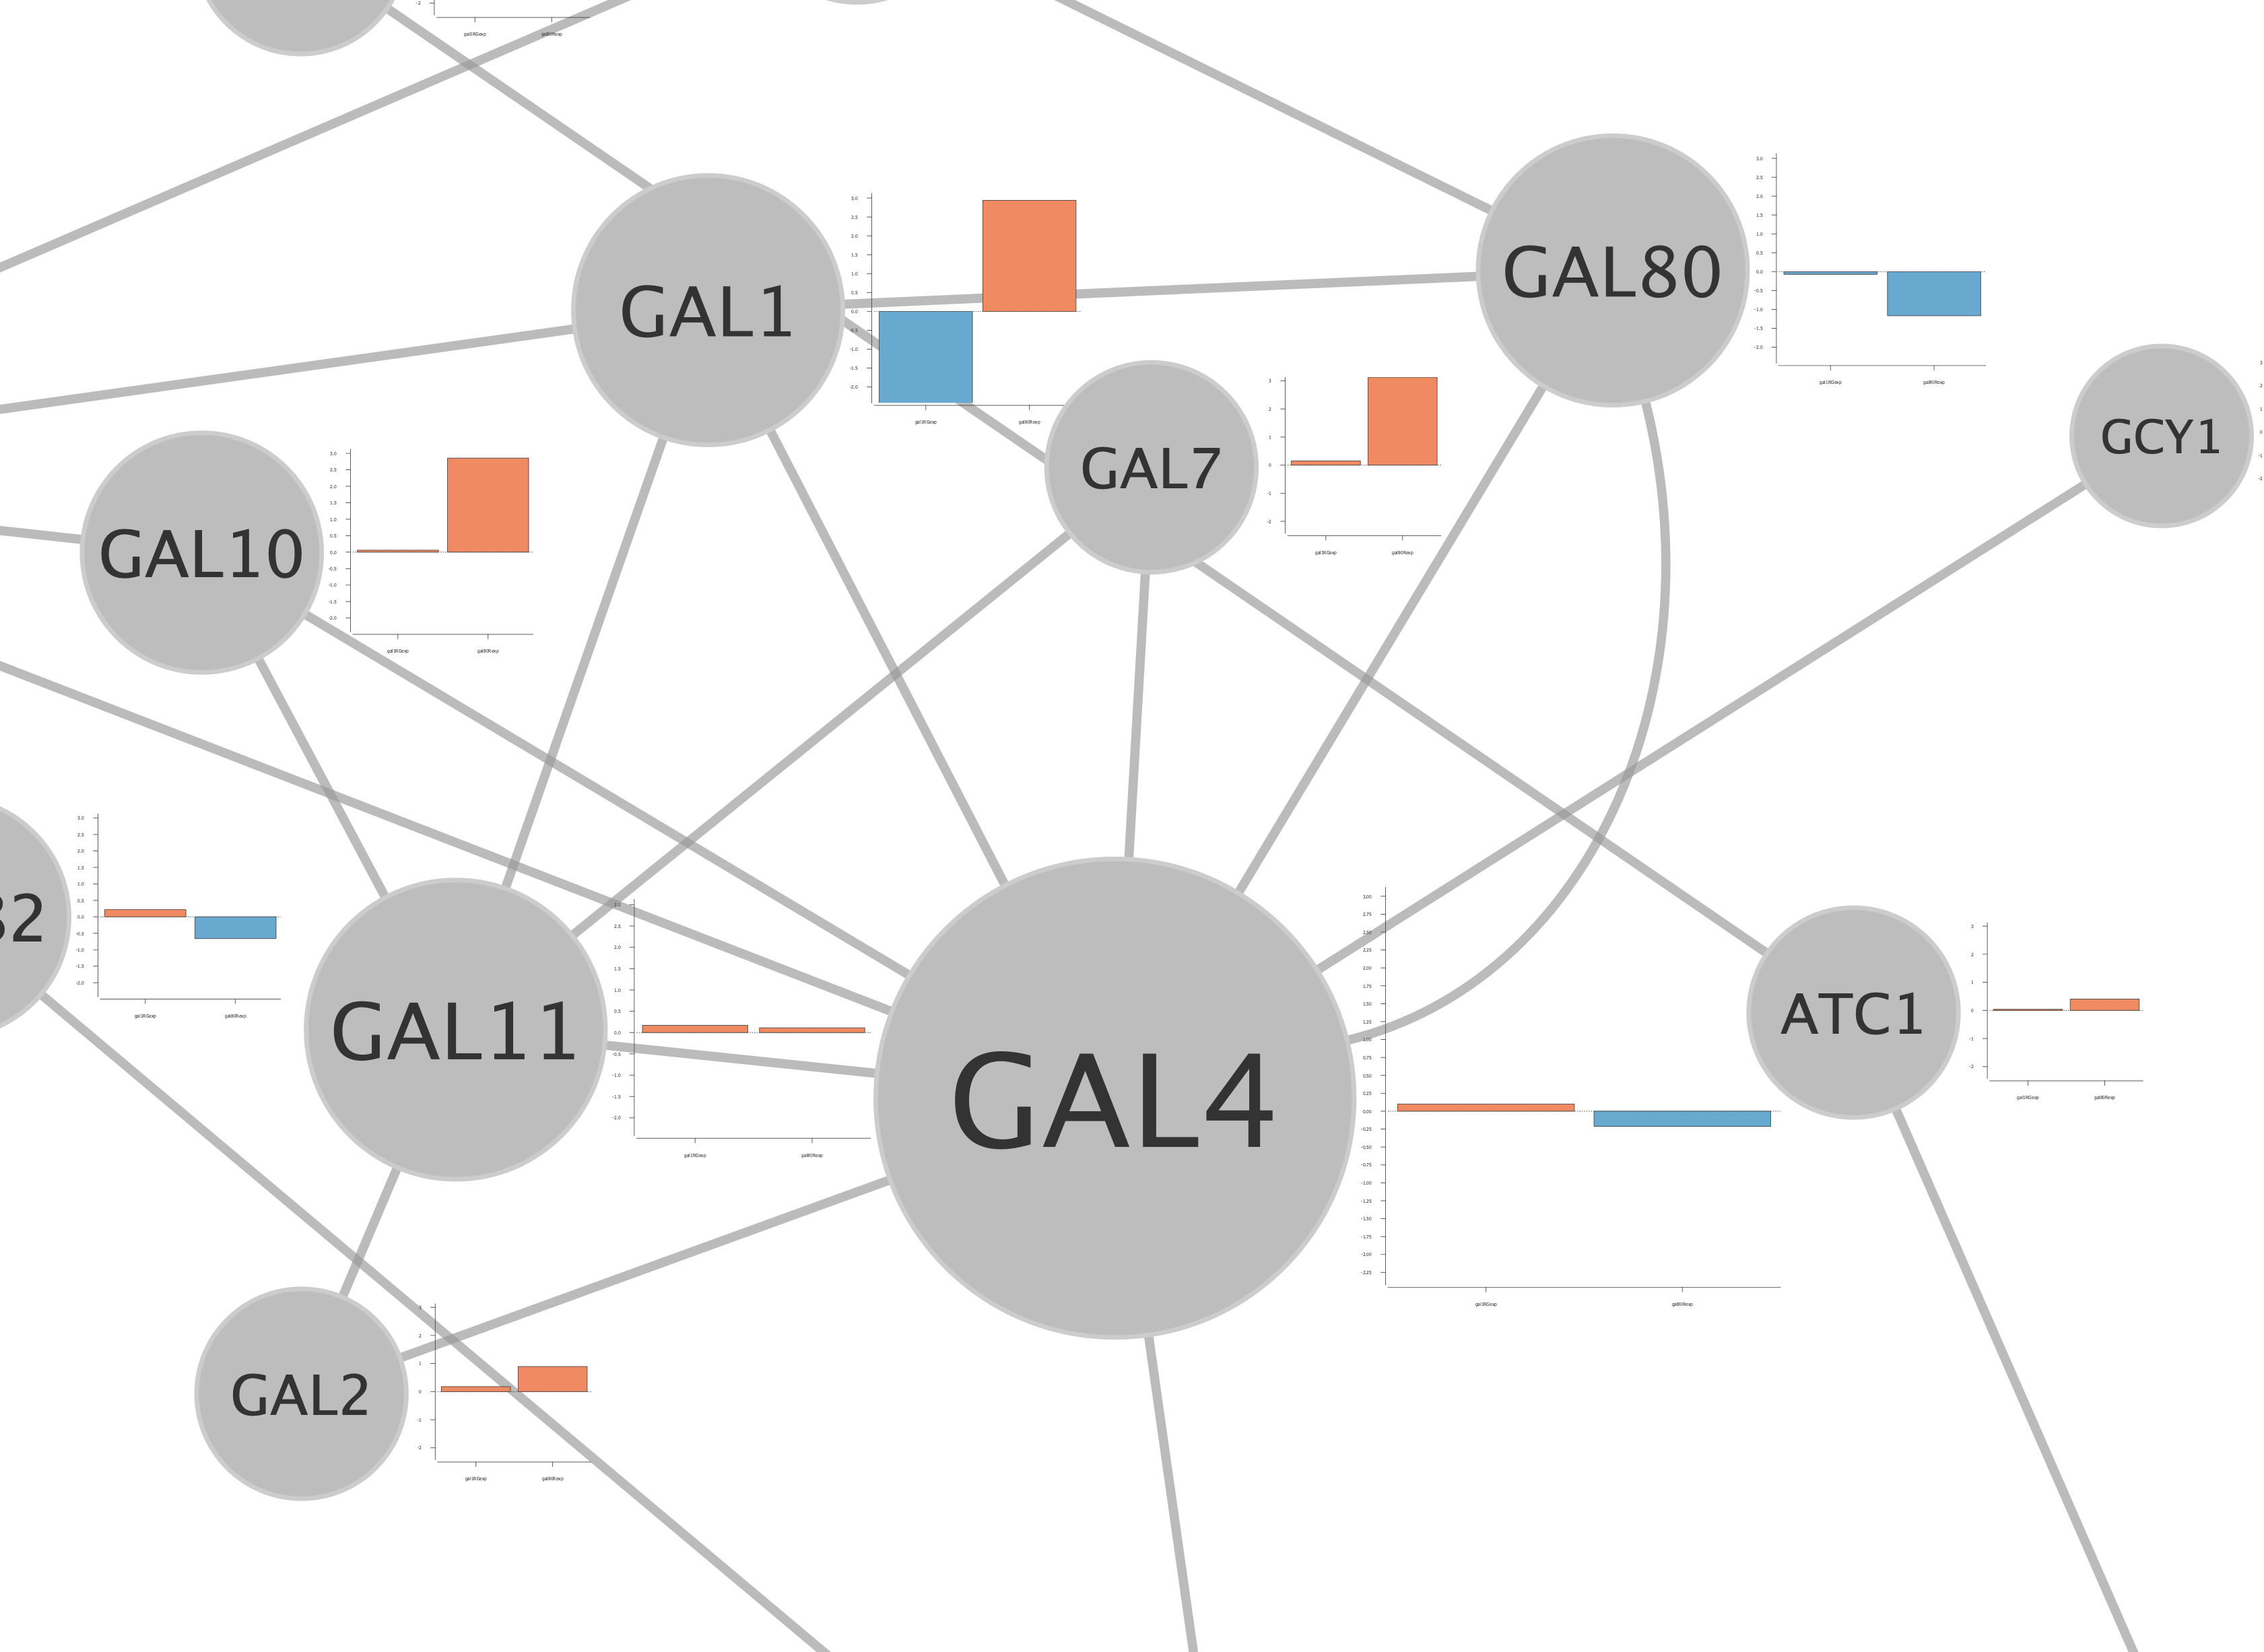
Image/Chart position 1 property to the list by selecting it in theProperties drop-down underPaint→Custom Paint 1→Image/Chart Position 1 . - Click the
Def. (default) column and set the chart position to the right of the node.
enhancedGraphics
enhancedGraphics was implemented before Cytoscape charts were added to Cytoscape core. The format is not nearly as convenient, but allows for greater flexibility and specificity. Briefly, adding a chart using enhancedGraphics is done as follows:
- Create a new text column in the node table.
- Add the chart instructions to the new column, see the manual for details on chart instructions.
- Set up a visual style that uses the column you created as a passthrough mapping for one of the CustomGraphics styles.
For a detailed exmaple of enhancedGraphics, see the Custom Graphics and Labels protocol.