RNA-Seq Data Network Analysis
This protocol describes a network analysis workflow in Cytoscape for differentially expressed genes from an RNA-Seq experiment. Overall workflow:
- Finding a set of differentially expressed genes
- Retrieving relevant networks from public databases
- Integration and visualization of experimental data
- Network functional enrichment analysis
- Exporting network visualizations

Setup
- Install the stringApp from the Cytoscape App Store, or via the
App Store panel and search for "stringApp".
Experimental Data
For this tutorial, we will use a dataset comparing transcriptomic differences between autistic and normal brain. The study has been published in Voineagu et al., and we will get a summarized dataset with fold change and p-value from the EBI Gene Expression Atlas.
- Download the data here: rna-seq-data-cytoscape.csv.
Retrieve Networks from STRING
To identify a relevant network, we will use the STRING database to find a network relevant to the list of up- and down-regulated genes.
- Open the example data file, rna-seq-data-cytoscape.csv, in a spreadsheet app and select all gene names, from the Gene Names column. This represents all significantly up- and down-regulated genes.
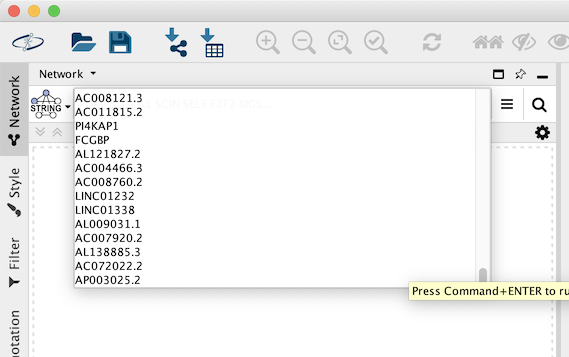
- Launch Cytoscape. In the
Network Search bar at the top of theNetwork Panel , selectSTRING protein query from the drop-down, and paste in the list of genes. - Click the search icon
 to search. The resulting network will load automatically, and should have around 150 nodes.
STRING Network Regulated Genes
The resulting network contains up- and down-regulated genes recognized by STRING, and interactions between them with an confidence score of 0.4 or greater.
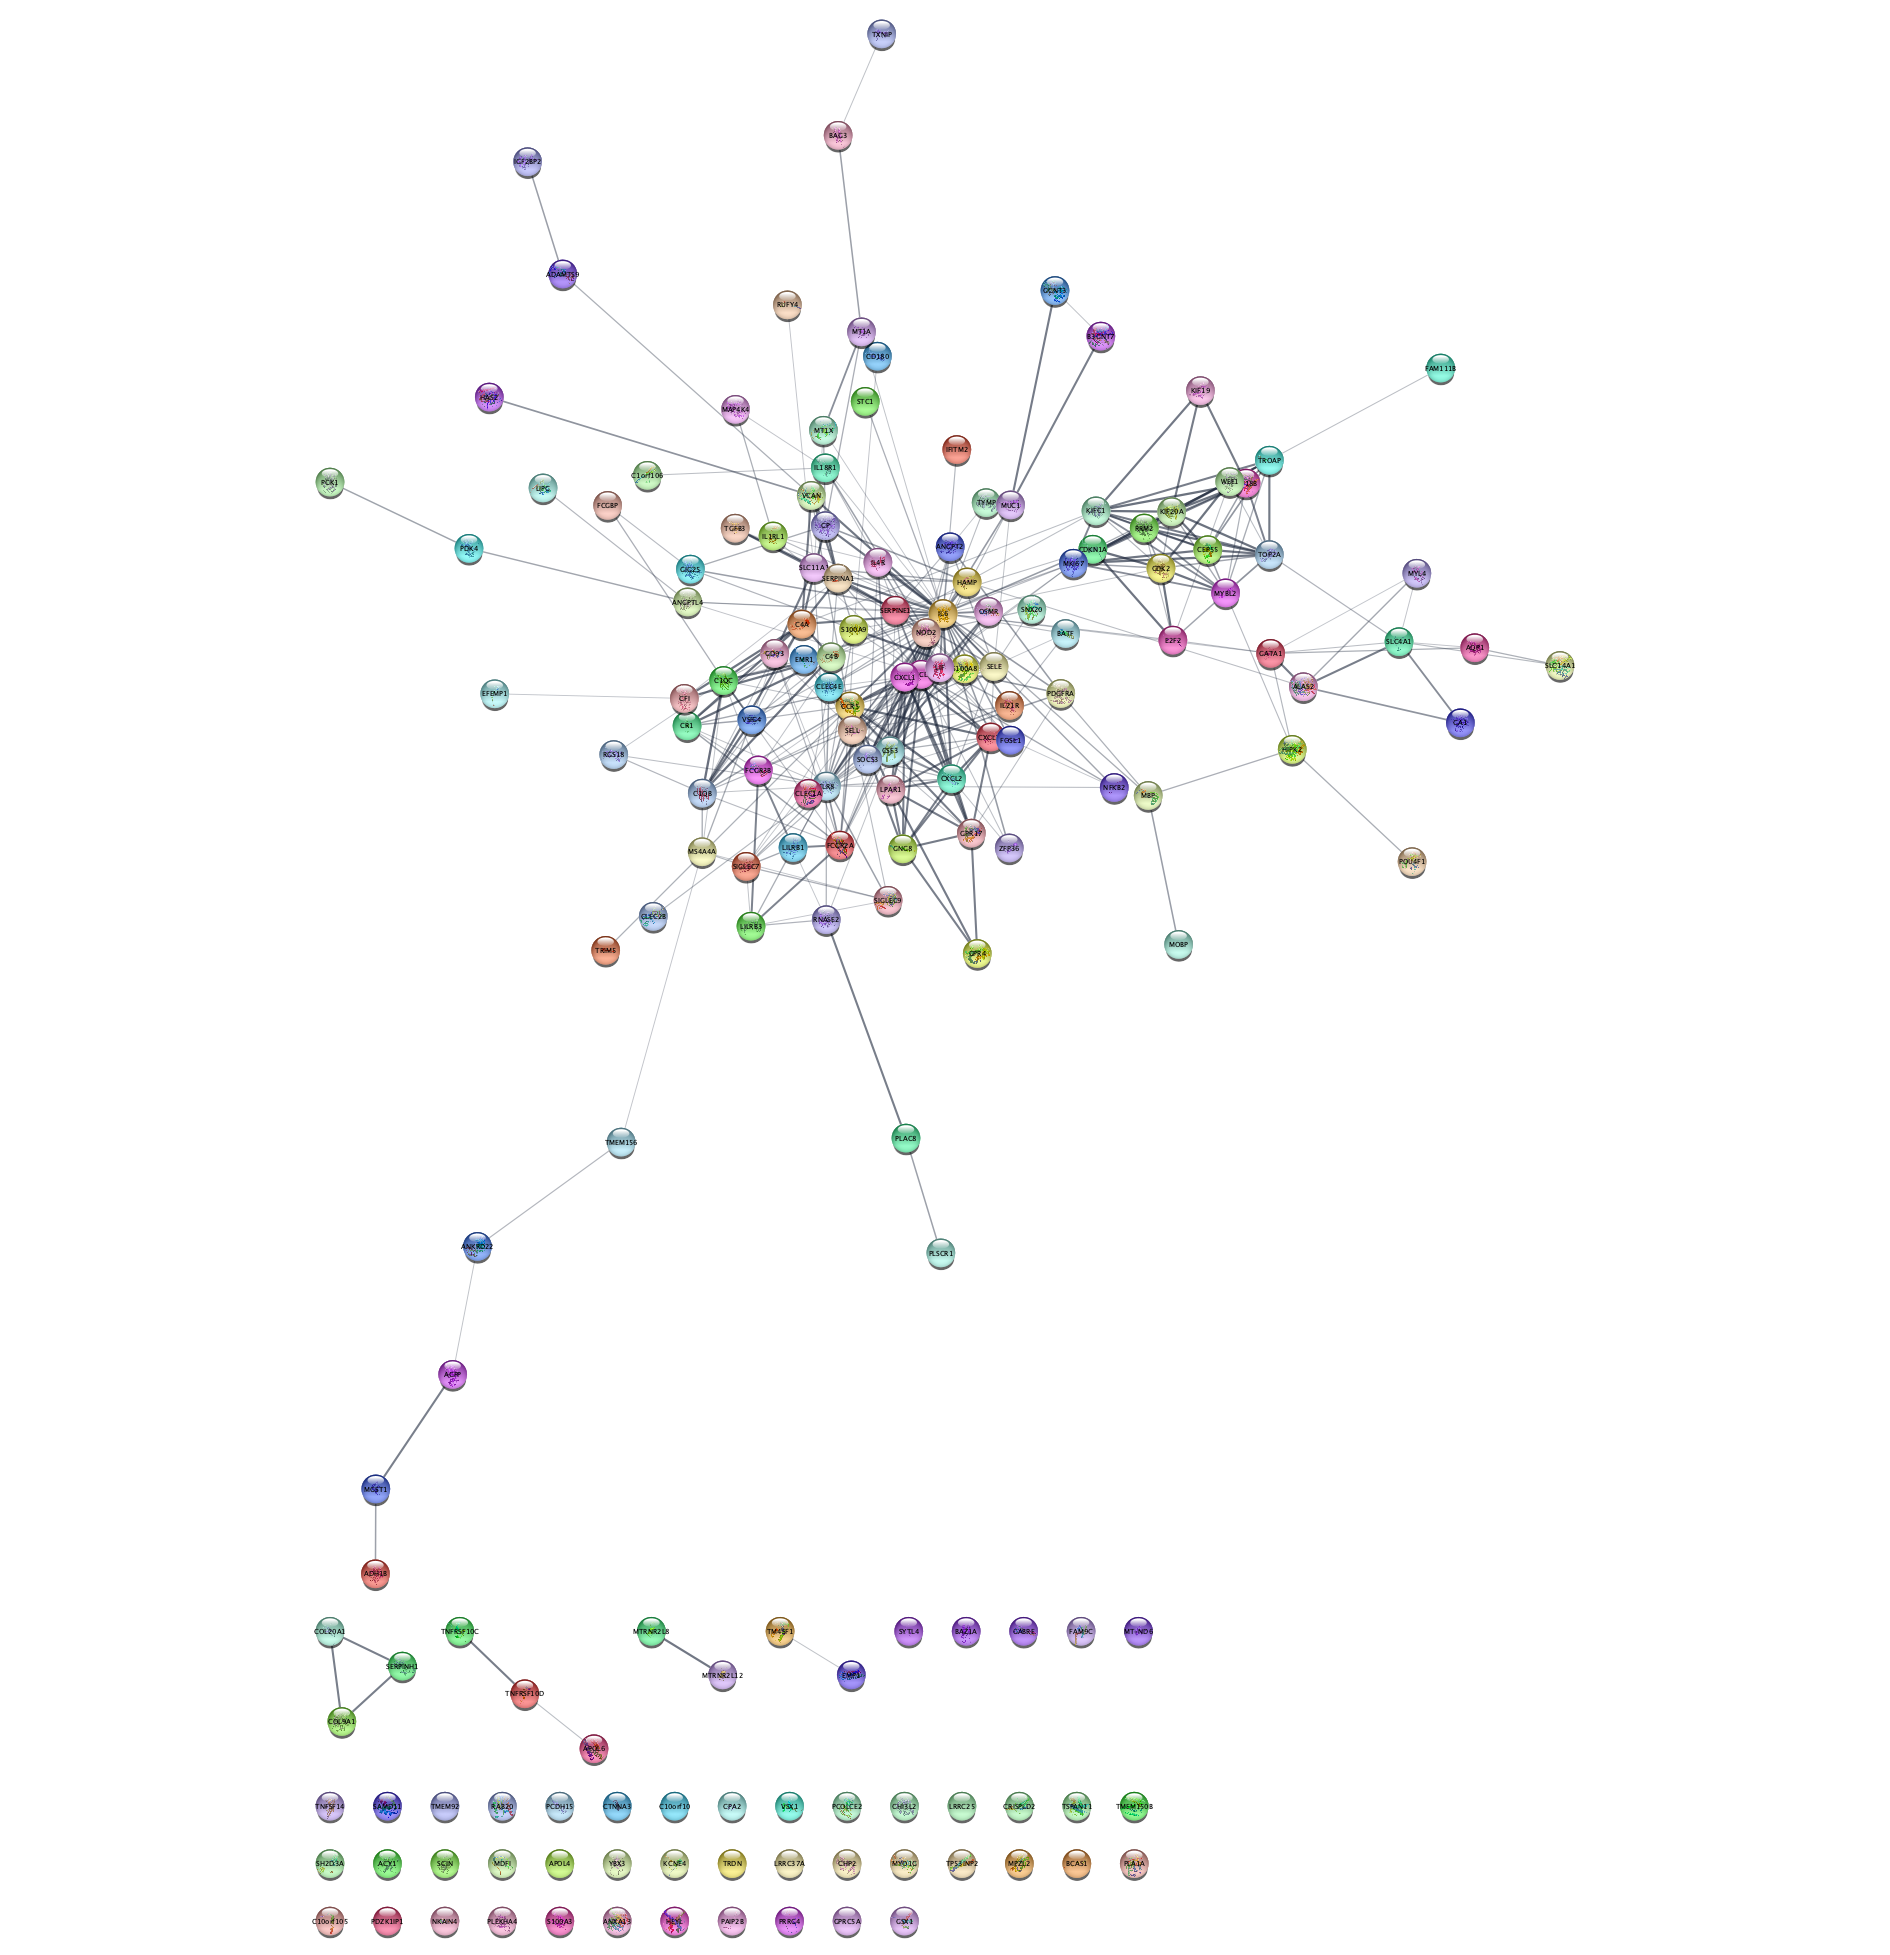
STRING Network Regulated Genes
The networks consists of one large connected component, several smaller networks, and some unconnected nodes. We will use only the largest connected component for the rest of the tutorial.
- To select the largest connected component, select
Select → Nodes → Largest subnetwork . - Select
File → New Network → From Selected Nodes, All Edges .
Data Integration
Next we will import the RNA-Seq data and use them to create a visualization.
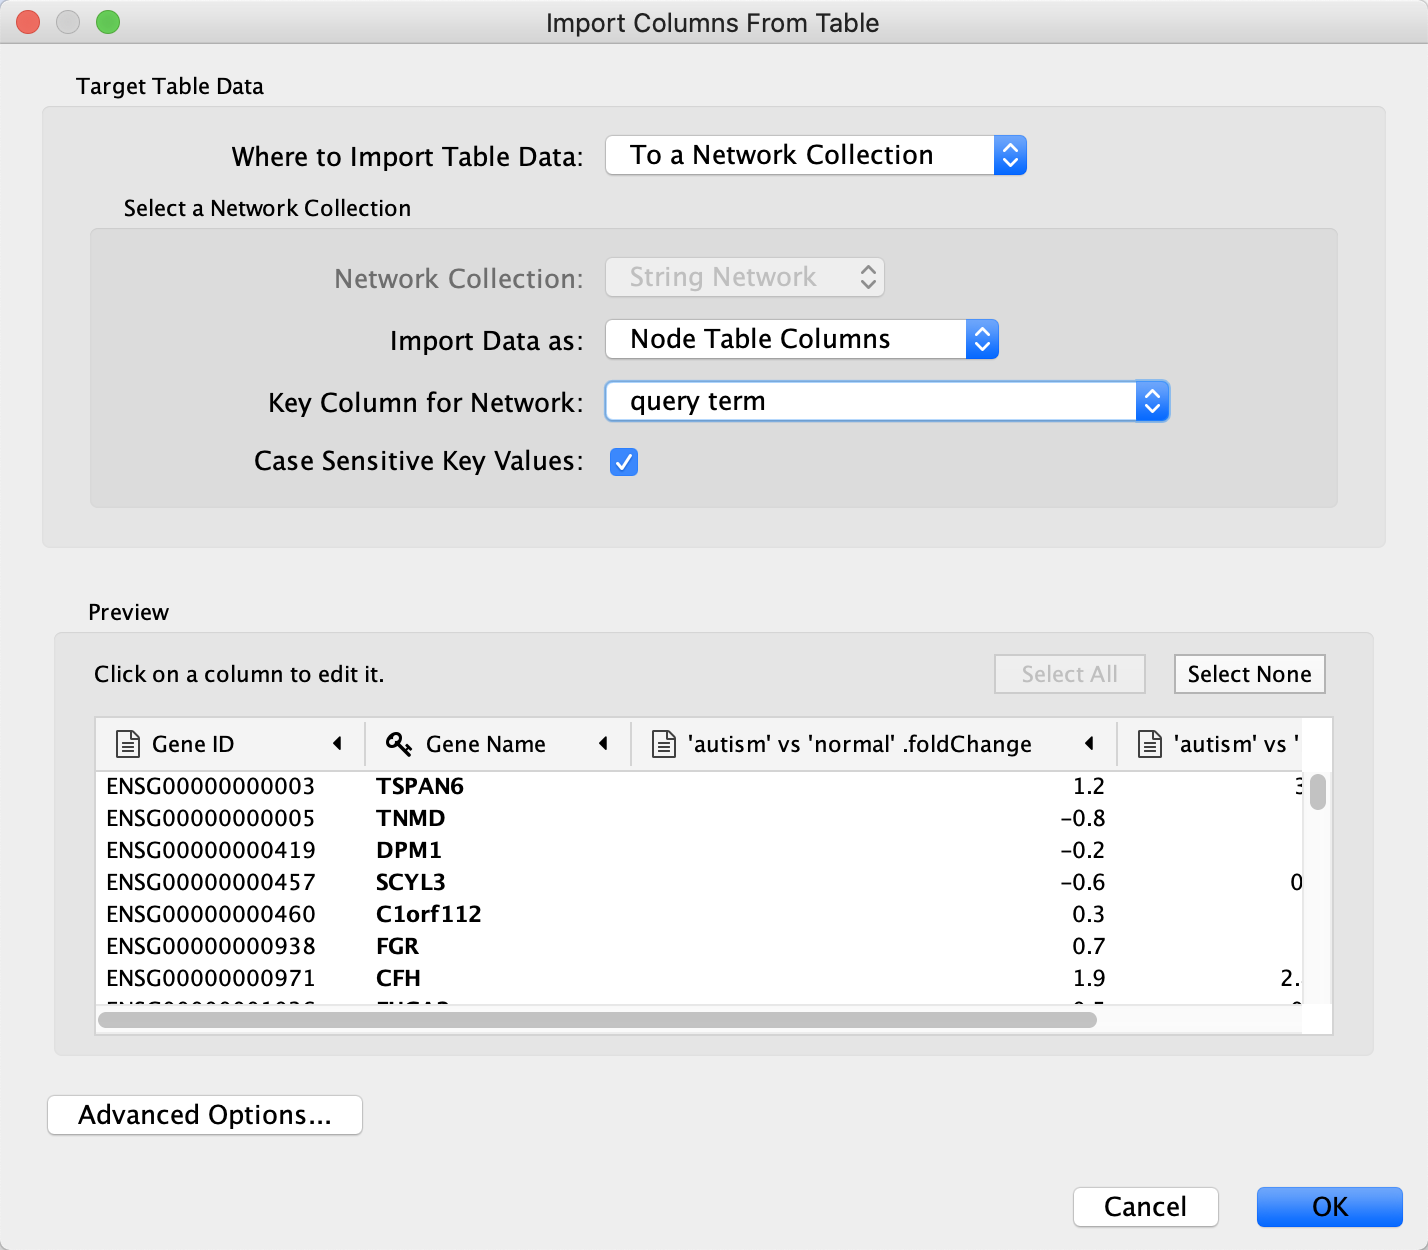
- Load the downloaded rna-seq-data-cytoscape.csv file under
File menu by selectingImport → Table from File.... . Alternatively, drag and drop the data file directly onto theNode Table . - For the Key column for Network choose query term to match the gene names in the sample dataset.
- Click
OK to import. Two new columns of data will be added to theNode Table .
Visualization
Next, we will create a visualization of the imported data on the network. For more detailed information on data visualization, see the Visualizing Data tutorial.
- In the
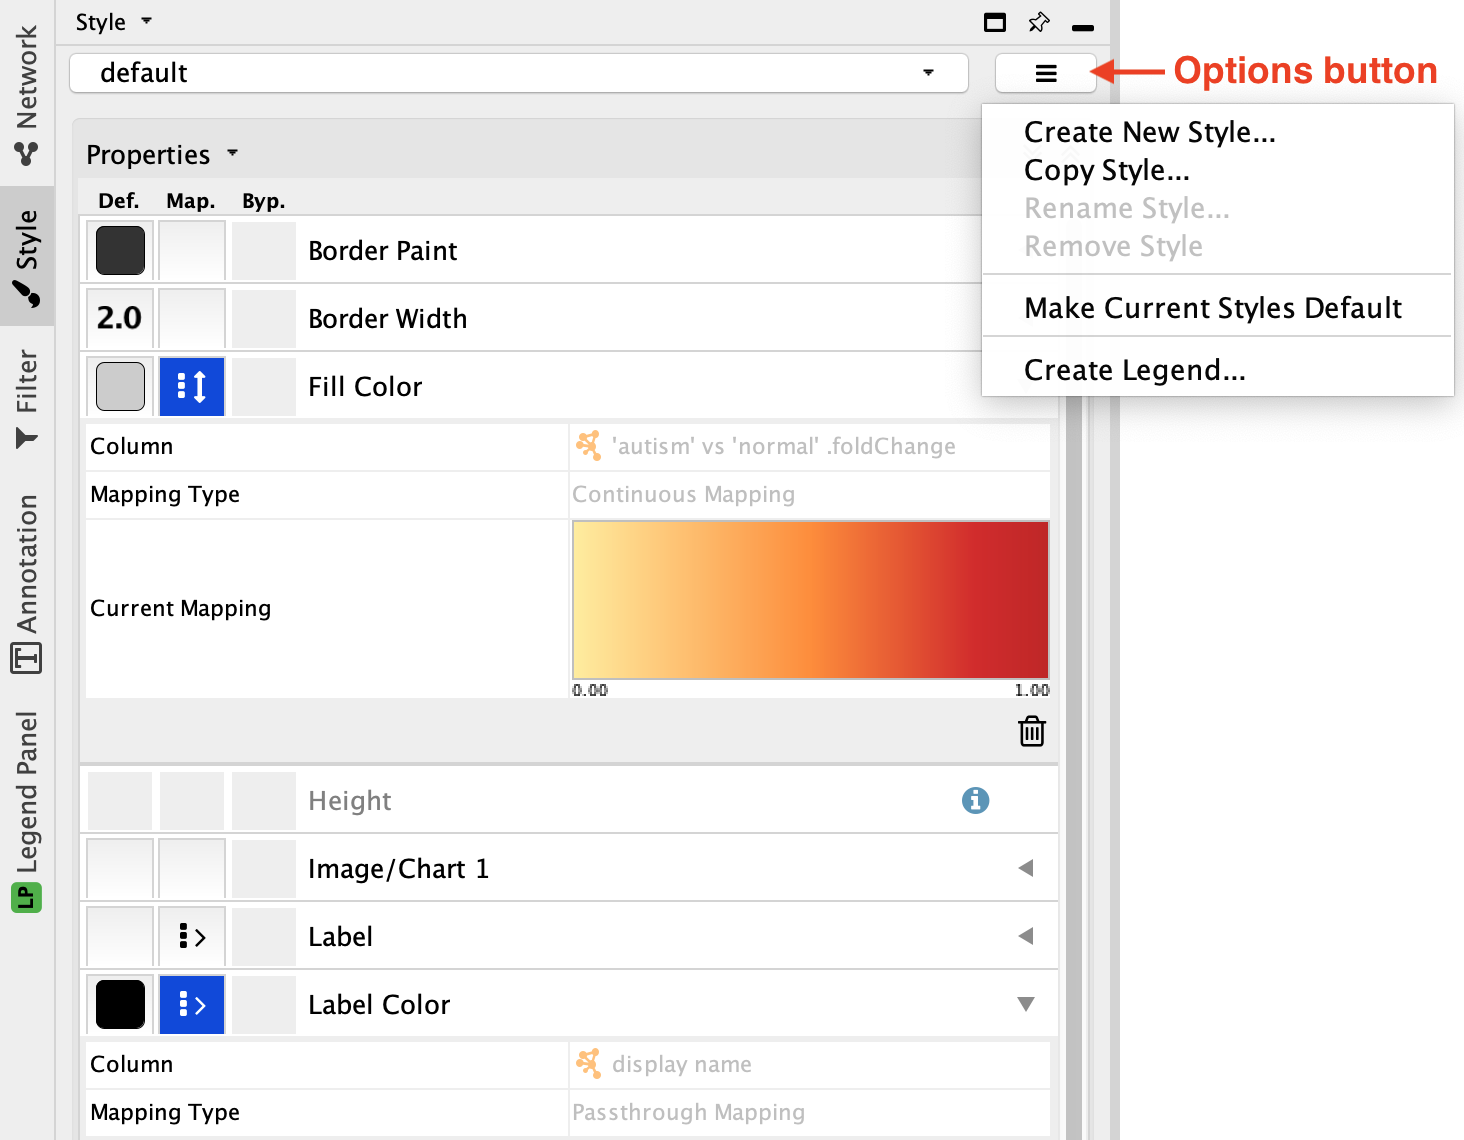
Style tab of theControl Panel , switch the style from STRING style to default in the drop-down at the top. - Copy the style to customize your own visualization via
Copy Style... in theOptions menu of theStyle interface, and name it de genes.
Visualization
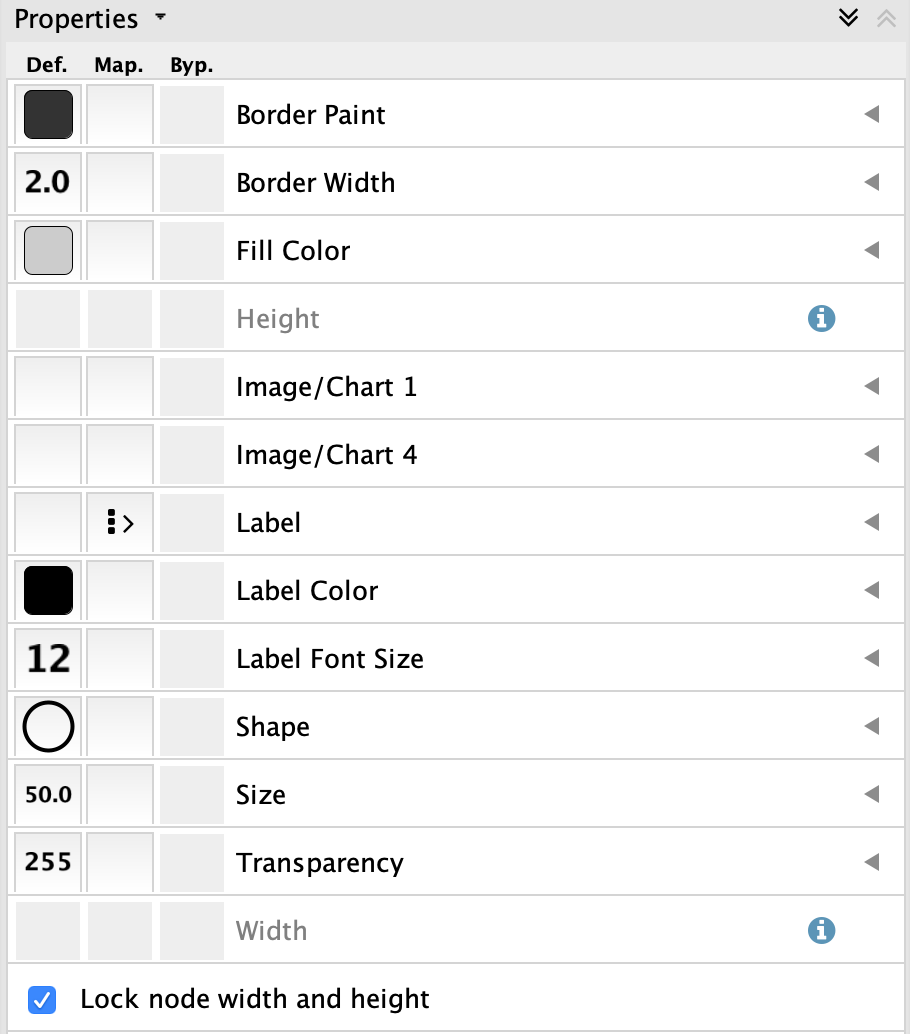
- Change the default node
Shape to ellipse and checkLock node width and height . - Set the default node
Size to 50. - For node
Label , set a passthrough mapping fordisplay name . - Set the default node
Fill Color to light gray. - For node
Fill Color mapping, choose column:Fold Change and mapping type:continuous . Keep the default red-blue color palette.
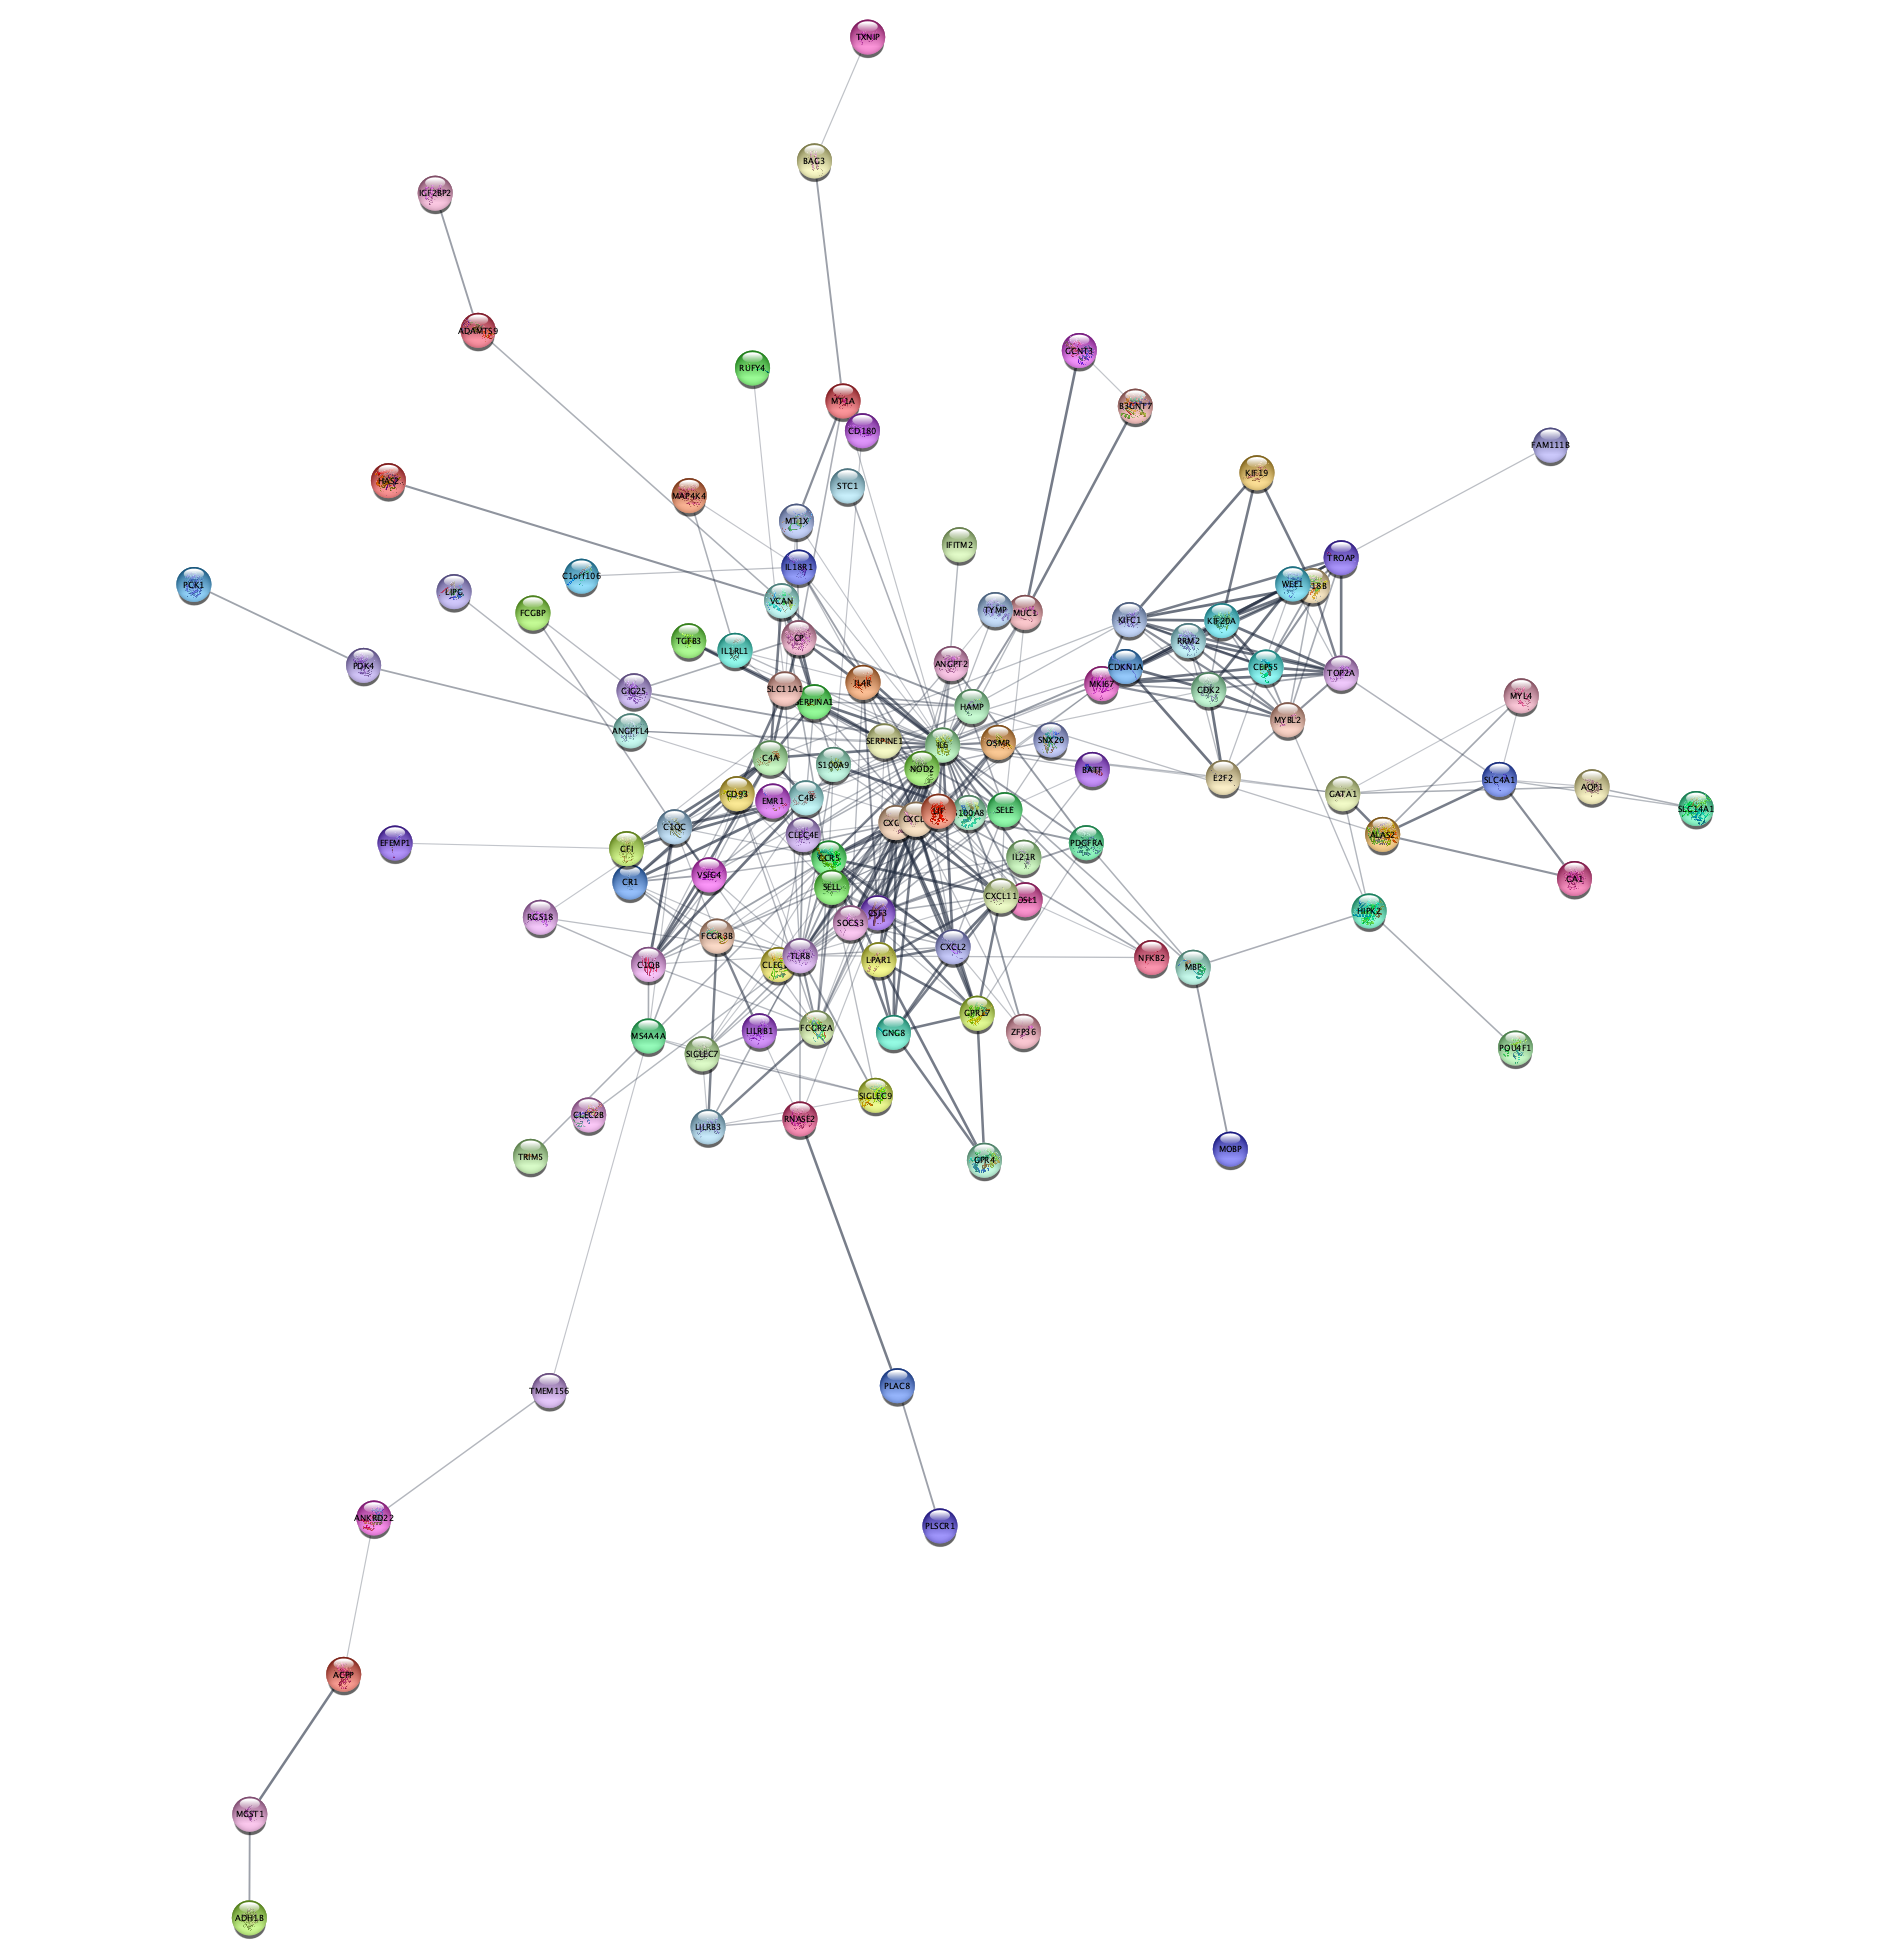
Visualization
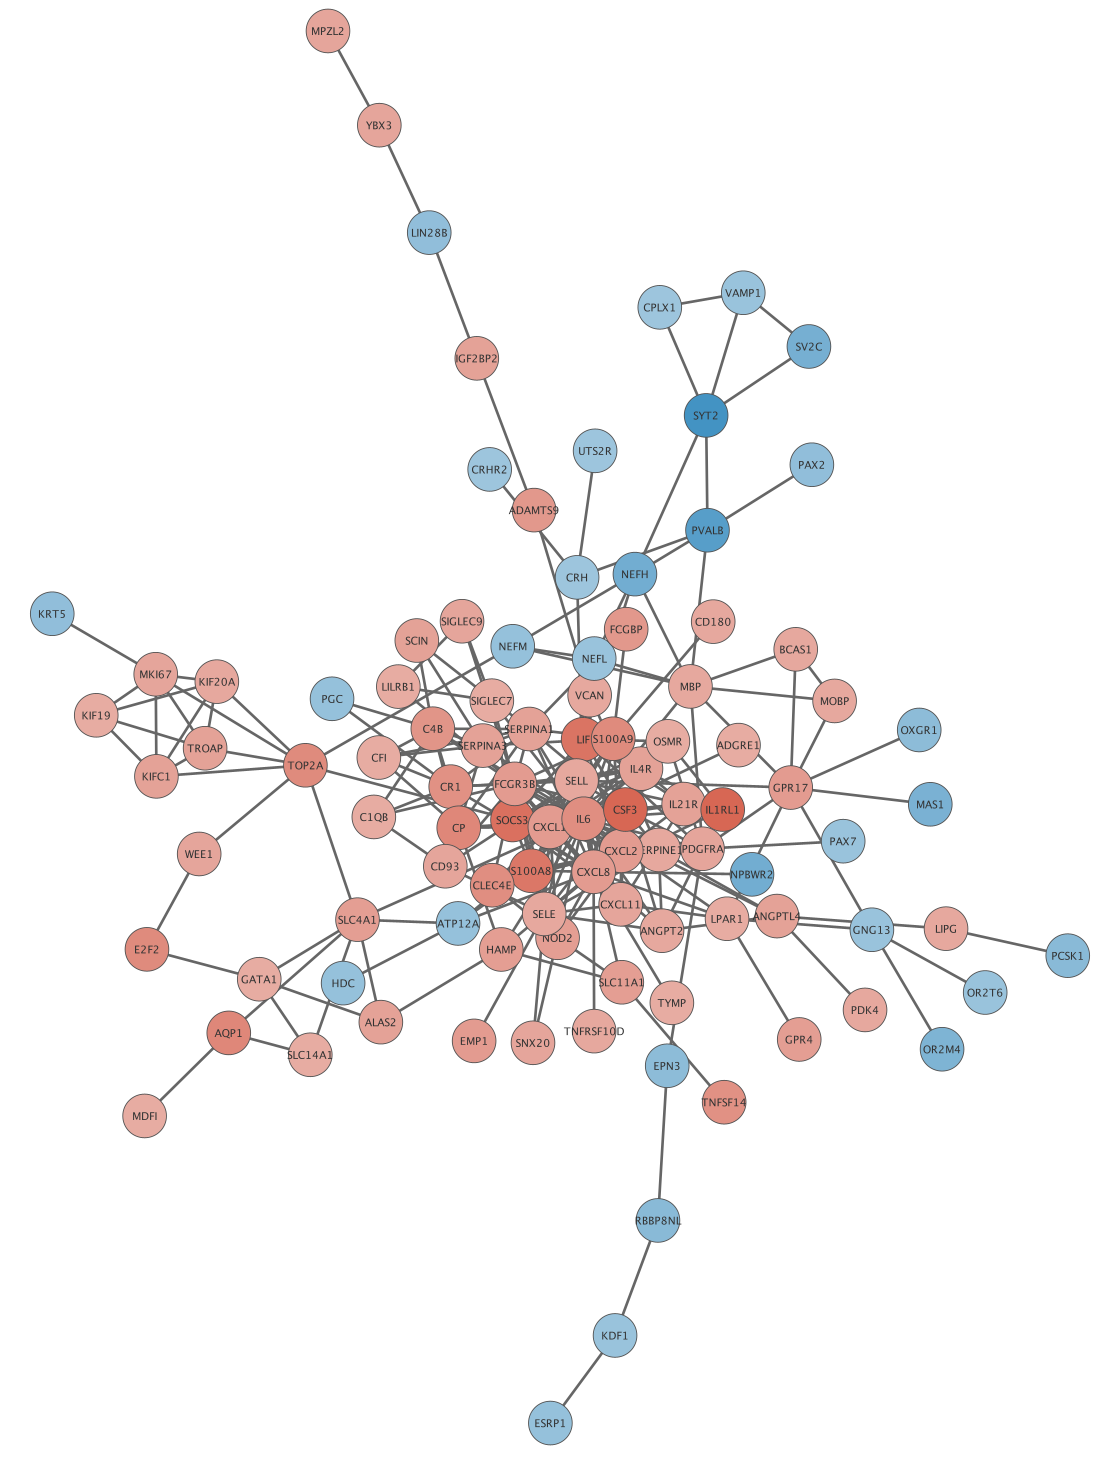
Apply the  button in the toolbar. The network will now look something like this:
STRING Enrichment
The STRING app has built-in enrichment analysis functionality, which includes enrichment for Gene Ontology, InterPro, KEGG Pathways, and PFAM.
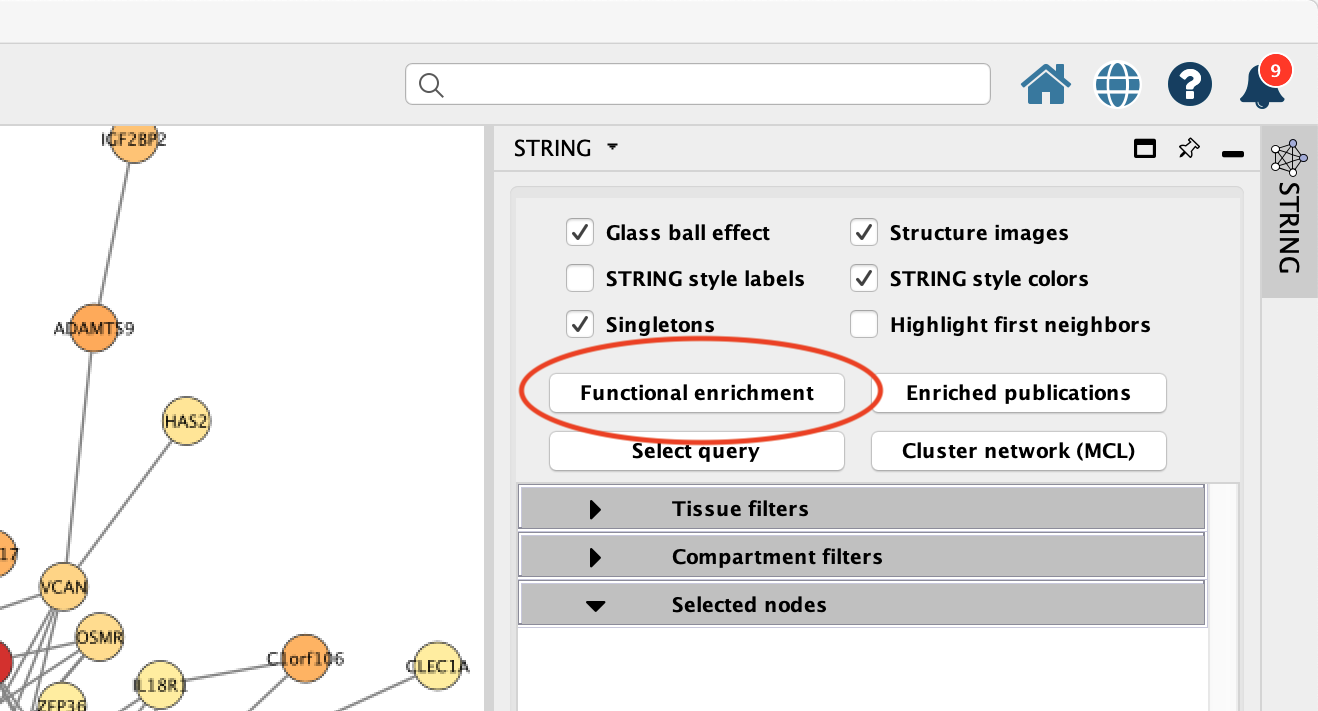
- In the STRING tab of the
Results Panel , click theFunctional Enrichment button. Keep the default settings.
STRING Enrichment
- When the enrichment analysis is complete, a new tab titled
STRING Enrichment will open in theTable Panel .
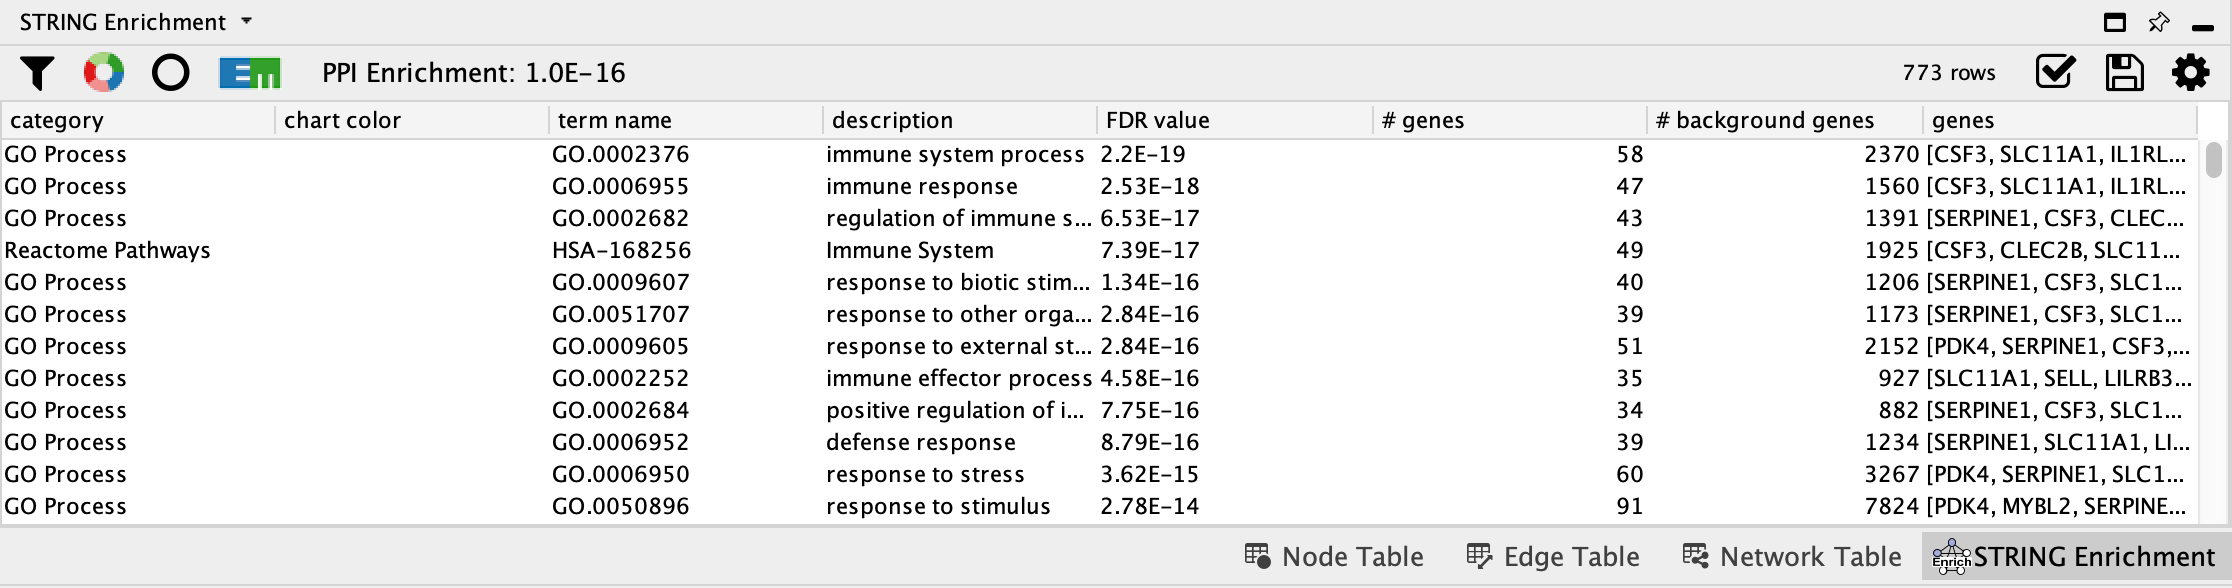
STRING Enrichment
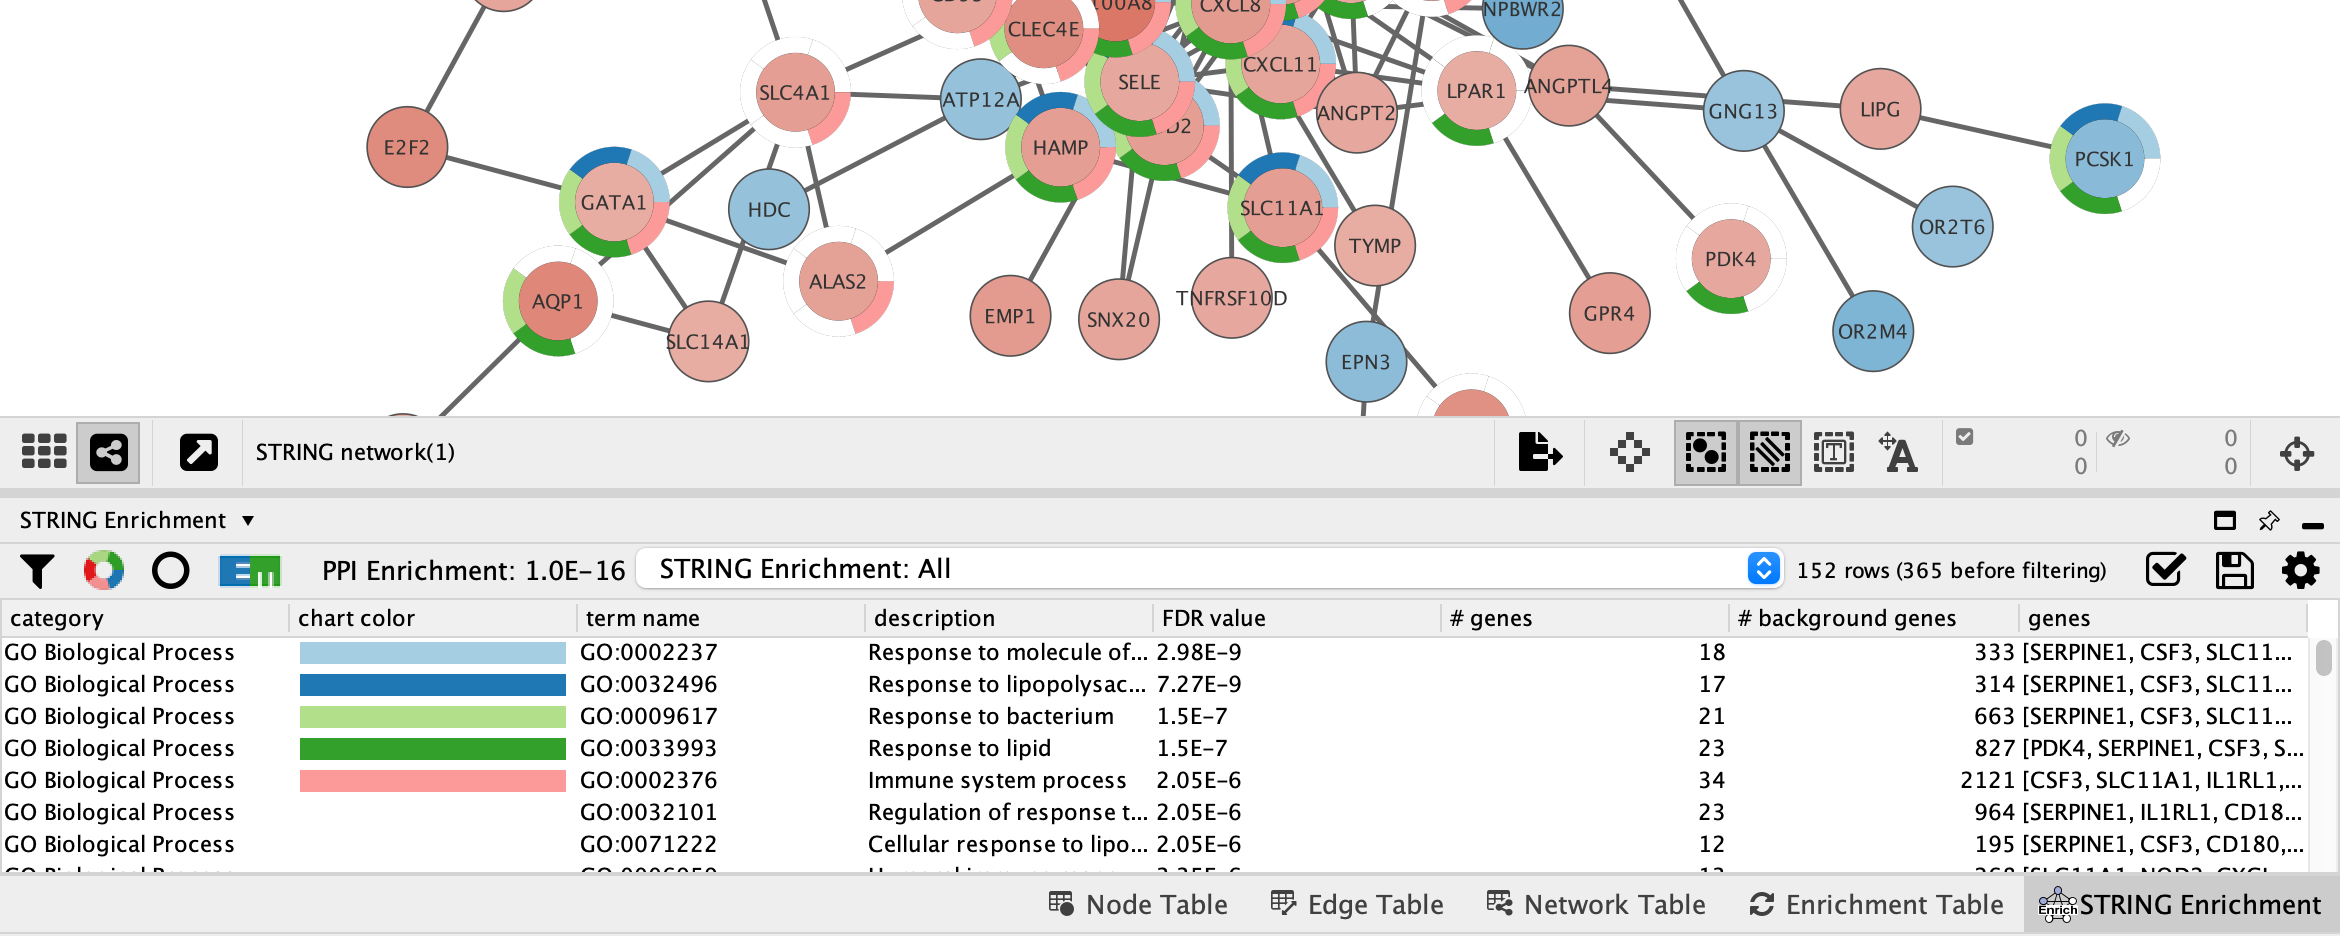
The STRING app includes several options for filtering and displaying the enrichment results. The features are all available at the top of the
- At the top left of the STRING enrichment tab, click the filter icon
 . Select
 GO Biological Process and check theRemove redundant terms check-box. Then click OK. - Next, we will add a split donut chart to the nodes representing the top terms by clicking on
 .
. - Explore custom settings via
 in the top right of the STRING enrichment tab.
Exporting Networks
Cytoscape provides a number of ways to save results and visualizations:
- As a session:
File → Save Session ,File → Save Session As... - As an image:
File → Export → Network to Image... - To the web: Open in Cytoscape Web App (available in AppStore)
- To a public repository:
File → Export → Network to NDEx - As a graph format file:
File → Export → Network to File .
Formats:- CX JSON / CX2 JSON
- Cytoscape.js JSON
- GraphML
- PSI-MI
- XGMML
- SIF